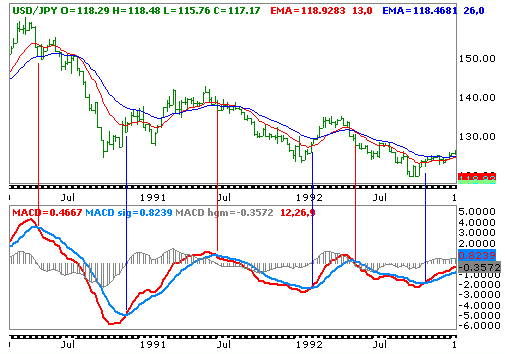
Let us take a look at the MACD plot on a weekly chart of USDJPY:

Broadly we would be pleased with the general signals being generated from MACD in this chart. While the crossover of the MACD across the signal line never really occur at market extremes, in this case they are pretty close and one cannot expect a lagging indicator to provide signals at price extremes.
It can be seen that before the moving averages cross the MACD is signaling a reversal earlier and allowing an early entry into a potential trade. Perfect. We can begin to trade on this indicator then… Or can we..?
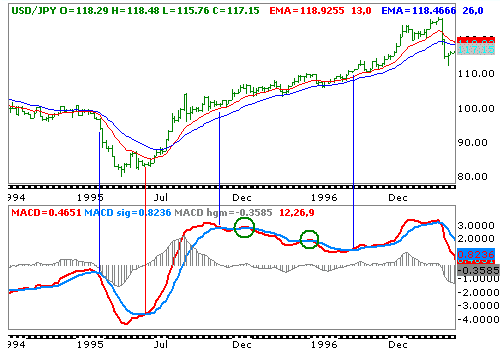
Take a look at the second chart, still the weekly chart of USDJPY but from a year or two later:

At first it looks quite good. MACD signals a sale into the large decline to the historic 79.70 low and a little later a reversal higher. There is lots of profit to be taken there. However, watch as the MACD peaks out soon after the initial rally from the 79.70 low. The two exponential moving averages continue to point higher and indeed do not cross lower until after the 147.65 peak. However, MACD spends around one year in a decline while price has continued to rally.
This is a recipe for losses.
Why is it that MACD can provide such a bad signal since it is based on two exponential moving averages?
The answer lies in the name: Moving Average Convergence and Divergence.
While the exponential moving averages are rising, the trend has slowed to the point that while only slightly the averages are converging – that is, moving closer together and this has caused the MACD to cross below the signal line.
Well, is there any way to control the trades to make sure that we do not make those trades? Indeed. One of the best tips I can offer is to remember the definition of a trend. An uptrend is where both highs and lows are moving higher. Thus, until the most recent low s broken there is no break/reversal of the trend.
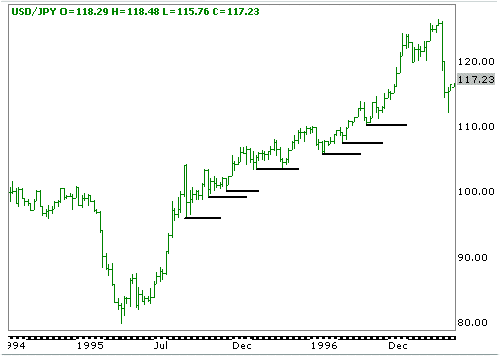
Let us look at how this would have worked:

As can be seen, I have drawn a horizontal line under each successive swing low. At no point is one of these broken until after the final high to the upper right of the chart. Thus, by combining information garnered from the price chart you can avoid many loss making trades.Good luck !